
U.S. Wage Growth Increased Substantially by 4.4 Percent; Wage Growth for Both Job Holders and Switchers Reached All-Time Highs of 5.9 Percent and 8.0 Percent Respectively as Firms Compete to Retain and Attract Workers
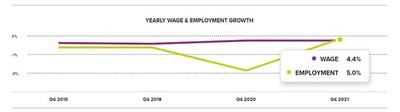
ROSELAND, N.J., Jan. 26, 2022 /PRNewswire/ -- Fourth quarter U.S. wage growth increased 4.4 percent. Wage growth for both job holders and job switchers hit all-time highs of 5.9 percent and 8.0 percent respectively, according to the ADP Research Institute® Workforce Vitality Report (WVR) released today. In fact, wage growth for Generation Z (24 years old and younger) job holders saw the largest wage gains in December 2021 at 13.1 percent. Employment growth increased by 5.0 percent in December 2021.
"ADP data showed U.S. wage growth increased 4.4 percent on average for all workers in December 2021, with job switchers and younger job holders who saw the largest wage growth," said Nela Richardson, chief economist, ADP. "Leisure and hospitality, which experienced the greatest job loss due to the pandemic, was a notable exception to this overall trend. While leisure and hospitality led employment gains in the first half of 2021, it is the only industry where job switchers' wages were basically flat on average in December 2021 compared to previous year."
Employment growth year-over-year increased 5.0 percent, with all sectors experiencing employment growth. While leisure and hospitality led the way with a 17.7 percent increase, overall employment levels for the sector remain below their high-water mark prior to the pandemic. However, wage growth for job holders and job switchers was the strongest in industries including professional business services (12.2 percent) and information technology (12.2 percent).
Table 1: Wage and Employment Growth by Industry – December 2021
Industry | YOY Wage Growth | Yearly Growth | |||||
All | All | Holders | Entrants | Switchers | Employment Growth | Switching Rate | |
-ALL- | $31.53 | 4.4% | 5.9% | 3.0% | 8.0% | 5.0% | 22.0% |
Construction | $31.56 | 4.1% | 6.1% | 4.7% | 7.3% | 4.5% | 16.0% |
Education and Health Services | $29.67 | 3.6% | 5.5% | 3.6% | 5.0% | 3.6% | 20.5% |
Finance and Real Estate | $36.90 | 3.8% | 5.4% | 0.2% | 9.9% | 1.4% | 17.1% |
Information | $46.92 | 6.5% | 6.0% | 6.0% | 12.2% | 1.8% | 18.3% |
Leisure and Hospitality | $19.38 | 2.1% | 6.7% | 4.5% | 0.4% | 17.7% | 29.4% |
Manufacturing | $32.71 | 3.9% | 6.0% | 6.8% | 8.7% | 3.2% | 18.4% |
Other Services | $26.24 | 2.2% | 5.1% | -0.7% | 5.7% | 5.4% | 15.5% |
Professional and Business Services | $40.56 | 6.2% | 6.4% | 7.5% | 12.2% | 3.9% | 25.4% |
Resources and Mining | $36.11 | -10.3% | 5.2% | 0.0% | 8.8% | 9.5% | 5.1% |
Trade, Transportation, and Utilities | $27.88 | 8.4% | 6.8% | -1.6% | 5.7% | 3.4% | 24.1% |
Across the U.S., all regions experienced wage growth over 3.0 percent. While job switchers saw record-setting wage growth, job switchers in the West and Northeast received the biggest gain at 9.2 percent and 9.0 percent. By firm size, midsized companies with 500 to 999 employees increased wages the fastest, up 9.1 percent in December 2021 from one year prior.
Table 2: Wage and Employment Growth by Region and Firm Size – December 2021
Region | YOY Wage Growth | Yearly Growth | |||||
Wages | All | Holders | Entrants | Switchers | Employment Growth | Switching Rate | |
-USA- | $31.53 | 4.4% | 5.9% | 3.0% | 8.0% | 5.0% | 22.0% |
MIDWEST | $29.23 | 4.1% | 5.9% | 3.7% | 7.2% | 3.7% | 20.9% |
NORTHEAST | $35.55 | 3.8% | 5.5% | 2.9% | 9.0% | 5.6% | 22.6% |
SOUTH | $29.21 | 4.6% | 5.9% | 1.7% | 7.1% | 4.5% | 22.4% |
WEST | $34.31 | 4.7% | 6.1% | 4.0% | 9.2% | 6.7% | 22.1% |
Company Size | |||||||
-ALL- | $31.53 | 4.4% | 5.9% | 3.0% | 8.0% | 5.0% | 22.0% |
49 or less | $28.43 | 2.5% | 5.1% | 3.8% | 6.0% | 4.8% | 17.8% |
50 to 499 | $31.67 | 4.7% | 6.1% | 5.3% | 8.1% | 3.7% | 23.5% |
500 to 999 | $32.68 | 5.9% | 6.3% | 5.7% | 9.1% | 5.8% | 21.8% |
1000 or more | $33.07 | 4.9% | 6.1% | 1.1% | 8.3% | 5.8% | 24.0% |
Wage gains for job switchers saw tremendous increases overall, with double digit increases for job switchers in industries including finance, information technology and professional business services with an average wage of $18.04 for females and $19.66 for males.
Table 3: Wage and Switching Rate by Industry and Gender – December 2021
Industry | Gender | Share | Switching | Switching | Switchers' |
ALL | Female | 48% | 23.00% | $29.08 | 8.07% |
Male | 52% | 21.15% | $34.41 | 7.88% | |
Construction | Female | 21% | 16.56% | $28.93 | 5.98% |
Male | 79% | 15.88% | $31.32 | 7.58% | |
Manufacturing | Female | 31% | 20.03% | $38.13 | 9.89% |
Male | 69% | 17.62% | $37.47 | 8.13% | |
Finance & Real Estate | Female | 54% | 16.90% | $31.83 | 9.74% |
Male | 46% | 17.24% | $43.08 | 10.30% | |
Information | Female | 38% | 18.90% | $50.16 | 12.70% |
Male | 62% | 17.97% | $55.84 | 12.15% | |
Professional & Business Serv | Female | 46% | 26.99% | $39.15 | 12.58% |
Male | 54% | 24.17% | $49.32 | 12.13% | |
Education & Health | Female | 75% | 21.08% | $24.76 | 4.57% |
Male | 25% | 18.56% | $31.86 | 6.13% | |
Leisure & Hospitality | Female | 49% | 29.40% | $18.04 | -1.38% |
Male | 51% | 29.44% | $19.66 | 1.80% | |
Trade, Transportation & Utilities | Female | 39% | 26.07% | $24.66 | 7.37% |
Male | 61% | 22.83% | $27.64 | 4.77% |
Across all age groups, wage growth was strongest among workers 24 years old and younger at 6.8 percent in December 2021. In contrast workers over 55, saw wage gains at just 2.7 percent. Wage gains for females outpaced male wages in December 2021, albeit from a lower base.
Table 3: Wages by Gender and Age – December 2021
24 or less | 25 to 34 | 35 to 54 | 55 or more | -ALL- | ||
Wage Growth | -ALL- | 6.8% | 5.9% | 4.1% | 2.7% | 4.4% |
Female | 7.1% | 7.4% | 5.7% | 3.3% | 5.7% | |
Male | 6.6% | 4.5% | 3.0% | 2.3% | 3.4% | |
Job Holder Wage | -ALL- | 13.1% | 9.2% | 5.6% | 3.5% | 5.9% |
Job Switcher Wage | -ALL- | 7.3% | 11.6% | 9.4% | 4.8% | 8.0% |
Wage Level | -ALL- | $16.89 | $27.19 | $35.61 | $35.69 | $31.53 |
Female | $16.05 | $26.03 | $31.65 | $29.68 | $28.00 | |
Male | $17.70 | $28.17 | $38.78 | $40.35 | $34.44 | |
Employment | -ALL- | 7.2% | 2.4% | 4.5% | 7.7% | 5.0% |
Female | 8.0% | 1.6% | 4.2% | 8.0% | 4.9% | |
Male | 6.4% | 3.2% | 4.8% | 7.4% | 5.2% | |
Males Earning More | 10% | 8% | 23% | 36% | 23% |
About the ADP Workforce Vitality Report
The ADP Workforce Vitality Report (WVR) was developed by the ADP Research Institute. It is an unprecedented, in-depth monthly analysis (published quarterly) of the vitality of the U.S. labor market based on actual data that identifies labor market trends and dynamics across multiple dimensions. These dimensions include employment growth, job switching, wage growth and hours worked. In addition to the macro data presented in the report, there are also segment-specific findings by industry, state, gender, age, experience, and pay level. Established in October 2014, the report methodology was updated in April 2018 utilizing monthly data to include additional data points and deeper insights. For more information about the report, please visit http://workforcereport.adp.com/.
Type of Workforce
Holders: Workers who were employed by the same company for the past 12 months. The wage growth is the rate of change in wages in that time period.
Switchers: Workers who changed employers between consecutive months. The wage growth is calculated from the 12-month moving average of wage growth.
Entrants: First time workers who are less than 25 years old. The wage growth is calculated from the 12- month moving average of wages.
To see detailed results from the ADP Workforce Vitality Report for December 2021, including data broken down by region, firm size, industry, gender, and age visit http://workforcereport.adp.com/.
About the ADP Research Institute
The mission of the ADP Research Institute is to generate data-driven discoveries about the world of work, and to derive reliable economic indicators from these insights. We offer these findings to the world at large as our unique contribution to making the world of work better and more productive, and to bring greater awareness to the economy at large.
About ADP (NASDAQ-ADP)
Designing better ways to work through cutting-edge products, premium services and exceptional experiences that enable people to reach their full potential. HR, Talent, Time Management, Benefits and Payroll. Informed by data and designed for people. Learn more at ADP.com.
ADP, the ADP logo, Always Designing for People and ADP Research Institute are registered trademarks of ADP, Inc. All other marks are the property of their respective owners.
Copyright © 2022 ADP, Inc.
![]()
![]() View original content to download multimedia:https://www.prnewswire.com/news-releases/us-wage-growth-increased-substantially-by-4-4-percent-wage-growth-for-both-job-holders-and-switchers-reached-all-time-highs-of-5-9-percent-and-8-0-percent-respectively-as-firms-compete-to-retain-and-attract-workers-301468513.html
View original content to download multimedia:https://www.prnewswire.com/news-releases/us-wage-growth-increased-substantially-by-4-4-percent-wage-growth-for-both-job-holders-and-switchers-reached-all-time-highs-of-5-9-percent-and-8-0-percent-respectively-as-firms-compete-to-retain-and-attract-workers-301468513.html
SOURCE ADP, Inc.